


Tracking and measuring performance is a critical part of growing your ecommerce business, but determining what metrics to measure can be tricky.
In this post, I’ll share the top 45 KPIs and how to calculate them, so you can ensure you’re tracking the metrics that matter most to your business’ success.
{{text-box}}
What Is an Ecommerce KPI?
An ecommerce Key Performance Indicator (KPI) is a metric that measures an online store's performance against specific goals. Tracking KPIs enables businesses to identify strengths and weaknesses and make adjustments to optimize operations and improve their bottom line.
Why Are KPIs So Important in Ecommerce?
KPIs are especially important in ecommerce because they allow merchants to gauge the success of their store to make informed decisions about how to optimize their business.
KPIs can measure various aspects of a business's performance, including website traffic, customer engagement, and sales. By tracking these (and other) KPIs, you can gain valuable insights into how your customers interact with your site and how you can improve your customer experience.
You can use this data to make decisions about how to adjust your website design, the products you sell, and other elements of your business.
KPIs can also help you track marketing performance, allowing you to measure the effectiveness of your campaigns so that you can make changes and improvements to ensure maximum ROI. Additionally, KPIs can provide insight into customer behavior, providing valuable data to create targeted campaigns and offers.
Overall - KPIs are essential to ensure your business runs as efficiently and profitably as possible.
Types of KPIs
There are numerous KPIs to measure but most will fit into one of the categories below:
Financial KPIs: measure and track a company's financial performance and include net profit, gross profit margin, liquidity ratio, and many others.
Customer KPIs: focused on customers, measuring issues related to customer efficiency, satisfaction, and retention.
Operational KPIs: aim to measure operational performance across a business such as on-time delivery and cycle time.
Sales KPIs: provide insight into areas such as sales growth and include metrics like total sales, average order value and customer lifetime value.
Marketing KPIs: measure the success of a business's marketing strategy. Examples of marketing KPIs include customer acquisition cost (CAC), return on ad spend (ROAS), and website traffic.
45 Vital KPIs for Ecommerce
You can track an almost endless number of KPIs, but some are more important than others. Here's a list of the top 45 you should track to maximize success.
Average Order Value (AOV)
Average Order Value (AOV) measures the average dollar amount spent per customer in a given period. It’s calculated by dividing the total revenue generated by the total number of orders placed. For example, if your store earns a total of $1,000 in revenue from 10 orders, your average order value would be $100 ($1,000/10).
Average Time to Purchase (ATP)
Average Time to Purchase (ATP) is a metric that measures the average time visitors to your site convert into customers. To calculate your ATP, you can use ecommerce analytics tools such as Google Analytics to find out how many sessions it takes for a customer to make a purchase.
Average Visitor Value
Average Visitor Value (AVV) is a metric used to measure the worth of a website visitor. It’s calculated by taking the total revenue generated from your site and dividing it by the total number of visitors over a specific period. For example, if your ecommerce site had total revenue of $10,000 and had 10,000 visitors over a month, your AVV would be $1.
Conversion Rate
Conversion rate measures the percentage of visitors to a website that complete a desired action, such as making a purchase. It’s calculated by dividing the number of conversions by the number of total visitors and multiplying by 100. For example, if your site has 200 visitors and 8 go on to make a purchase, your conversion rate would be 4% (8/200 x 100).
Conversion Rate Per Channel
Conversion rate per channel measures the success of different marketing or sales channels. It's calculated by dividing the total number of conversions (sales or other desired outcomes) by the total number of visitors or leads generated by that particular channel. For example, if a marketing campaign generated 1000 visitors and 10 sales, the conversion rate per channel would be 1%.
Cart Abandonment Rate
Cart Abandonment Rate measures how many shoppers add items to their shopping cart but fail to complete the purchase. It’s calculated by dividing the number of abandoned shopping baskets by the total number of baskets created, multiplied by 100.
Customer Acquisition Cost (CAC)
CAC measures how much it costs to acquire new customers and is an essential metric for ecommerce businesses to track. It’s calculated by dividing the total cost of sales and marketing activities over a specific period by the number of new customers gained during that period.
Customer Lifetime Value (CLV)
Customer Lifetime Value (CLV) is a metric used to measure the total value of a customer to a business over the lifetime of their relationship. It’s calculated by multiplying the average sale value by the average number of times a customer purchases and then multiplying that by the average length of time a customer remains a customer.
For example, if your business has an average sale value of $100, an average purchase frequency of five times a year, and an average customer lifetime of five years, the CLV would be $2,500.
Return Visitor Rate
Return Visitor Rate is a metric used to measure a website’s ability to retain visitors over multiple visits. It’s calculated by dividing the total number of unique returning visitors to a website by the total number of all visitors over a given period and expressing the result as a percentage.
For example, if your website had 100 unique visitors in a month, and 20 of them returned at least once, your Return Visitor Rate would be 20%.
Revenue Per Visitor
Revenue Per Visitor (RPV) measures the revenue generated from each visitor to your website. It’s calculated by dividing the total revenue generated by the total number of visitors to the website. For example, if your website generated $1,000 in revenue from 1,000 visitors, your RPV would be $1.
Page Views Per Visitor
Page Views Per Visitor measures the average number of page views a visitor takes during a single visit to your website. It’s calculated by dividing the total number of page views by the total number of visitors. For example, if a website had 1,000 page views and 500 visitors, the Page Views Per Visitor metric would be 2.
Time on Site
Time on site is a metric that measures how long visitors spend on your website. It is generally calculated by subtracting the time of the first pageview from the time of the last pageview. This gives you the total amount of time spent on your website by a visitor.
Unique Visitors
Unique visitors are distinct individuals who visit your website during a given period. You can view unique visitors using web analytics software like Google Analytics. These tools consider each visitor’s IP address and filter out any visits from the same IP address within the same period.
Website Visits
Website visits is a term used to describe the total number of visits a website receives in a given period. It is usually calculated by summing the number of page views and unique visitors to the website in a given period. This metric helps measure the success of your website in terms of engagement and reach.
Bounce Rate
Bounce rate measures how many visitors leave your website after viewing only one page. It’s calculated by dividing the total number of single-page visits by the total number of visits to the website (expressed as a percentage). Bounce rate helps evaluate the effectiveness of your website’s content and user experience.
Click-through Rate (CTR)
Click-through Rate (CTR) measures the effectiveness of a marketing campaign or advertisement. It’s calculated by dividing the total number of clicks by the total number of impressions (ad views) and multiplying by 100 to get the percentage rate. For example, if an ad had 1000 impressions and 10 clicks, its CTR would be 1%, calculated as 10/1000 x 100.
Cost Per Acquisition (CPA)
Cost Per Acquisition measures the cost associated with acquiring a customer. It's usually calculated by dividing the total cost of marketing efforts by the number of customers acquired. For example, if your total marketing costs were $2,000 and you acquired 10 customers, your CPA would be $200.
CPA is a valuable metric in examining the effectiveness of your marketing efforts and helps you decide what type of campaigns may be the most cost-effective for acquiring customers.
Organic Traffic
Organic traffic is the number of visitors who come to your site through unpaid search engine results (i.e., not through paid advertising). It's calculated by subtracting the number of visitors who come through paid search engine results from the total number of visitors.
Organic Search Ranking
Organic search ranking is the position your website holds in search engine results. Your organic search ranking is important because it determines your site's visibility to potential customers. A website with a high organic search ranking is more likely to be seen by more people, leading to more traffic and potential customers. This can result in more sales and more revenue.
Traffic Volume
Traffic volume measures the total number of visitors to your website. Web analytics tools such as Google Analytics provide detailed information about the number of visitors to your website, the pages they visited, the countries they come from, and the devices they used to access the website.
Web Traffic Sources
Web traffic sources describe the origin of web visits to your website. Understanding the source of web visits is essential since it can help inform your marketing strategies and website design decisions. To view your web traffic sources, you can use analytics data from Google Analytics or other web analytics tools.
Average Session Duration
Average session duration measures the average time a user spends on a website. It's calculated by dividing the total time spent in all sessions by the total number of sessions. This metric is often helpful in evaluating user engagement and understanding user behavior.
Pageviews per Session
Pageviews per session is a metric that measures the average number of pages a user views during a single session on your website. It's calculated by dividing the total number of pageviews during a given period by the total number of sessions during the same period.
Email Click-Through Rate (CTR)
Email Click-through Rate (CTR) is a metric used to measure the effectiveness of an email marketing campaign. It's calculated by dividing the number of people who click on a link in an email by the total number of emails sent. For example, if you sent an email to 1,000 people and 200 people clicked on the link, your CTR would be 20%.
Email Open Rate
Email open rate measures the number of emails opened versus the number of emails sent. It's calculated by dividing the number of emails opened by the number of emails sent and multiplying by 100. For example: If you sent out 1,000 emails to customers and 500 of them were opened, your email open rate would be 50%.
Revenue per Email
Revenue per email is a metric that measures the revenue generated by individual emails sent to customers. It's calculated by dividing the total revenue generated from emails sent to customers by the total number of emails sent. For example, if your business sends out 500 emails that generate $2,000 in revenue, the revenue per email is $4.
Social Engagement
Social engagement is a valuable metric to measure the success of your social media campaigns. It's measured by calculating the number of likes, shares, comments, clicks, and other interactions with your content. Tracking this KPI can help your business gain insight into how customers engage with your content.
ROAS
Return on Advertising Spend or ROAS measures the effectiveness of an advertising campaign. It's calculated by dividing the total revenue from the campaign by the total amount spent on advertising. For example, if one of your advertising campaigns generated $2,000 in sales and cost $500, your ROAS would be 4 (2,000/500 = 4).
Total Sales
Total sales measures the total revenue generated from the sale of products over a certain period. To calculate your total sales, multiply the total number of products purchased by the unit price. For example, if you sold 100 items at $10 each, your sales would be $1,000.
Net Profit
Net profit (aka the bottom line) refers to a business’s total earnings (or profit) minus its total expenses. To calculate your net profit, subtract the total expenses from the total revenue. Calculating net profit is important because it is the most accurate indicator of your business’s financial health and performance. It's the key metric used to assess the success of your business over time.
Gross Profit
Gross profit is the difference between a company’s total revenue and its total cost of goods sold. It’s calculated by subtracting the total cost of goods sold from the total revenue. For example, if a company’s total revenue is $100,000 and its cost of goods sold is $60,000, its gross profit would be $40,000.
Return on Investment (ROI)
ROI measures the profitability of an investment. It's calculated by taking the amount of money gained or lost on an investment and dividing it by the amount of money originally invested. It's calculated by dividing the net profit of an investment by the cost of the investment and multiplying the result by 100.
Upsell Rate
Upsell rate is a measure of the success rate of upselling, which is the practice of encouraging customers to purchase more expensive items or add more items to their cart. It's calculated by dividing the number of upsells by the total number of customers offered an upsell. This calculation will give you the percentage of customers who accepted the upsell offer.
Add to Cart Rate
Add to Cart Rate measures the percentage of people who added a product to their basket. To calculate this KPI, divide the number of user sessions when a product is added to a basket by the total number of sessions, then multiply the result by 100.
Average Cart Size
Average cart size is the total amount of money spent on a single purchase divided by the total number of purchases. To calculate it, add all the individual purchases made and divide that number by the total number of purchases. For example, if customers made 10 purchases totaling $200, the average cart size would be $20 ($200/10).
Inventory Turnover
Inventory turnover measures how quickly a business sells its inventory. It’s calculated by dividing the cost of goods sold by the average inventory on hand during a specific period. This metric shows how efficiently a business manages its inventory and how quickly it can turn that inventory into sales.
Number of Orders
Number of orders measures the total number of orders placed during a given period. It's calculated by taking the total number of orders placed in a specified period and dividing it by the number of days in that period. For example, if your business had 200 orders in a month, you calculate the number of orders as 200/30 (days in the month) = 6.67 orders per day.
On-Time Delivery
On-time delivery measures the accuracy and reliability of a business’s delivery service. It’s calculated as the percentage of shipments that arrive at their destination on time or within an agreed-upon time frame. To calculate on-time delivery, divide the total number of orders that arrived on time by the total number of orders sent. Then multiply the result by 100 to get the percentage.
Total Revenue
Total revenue is the total amount a business earns from selling its goods or services. It’s calculated by multiplying the quantity of products sold by the price of each unit. For example, if your business sells 200 units of a product at $10 per unit, the total revenue would be $2,000.
Net Promoter Score (NPS)
Net Promoter Score (NPS) measures customer loyalty and satisfaction with a product. It’s calculated by subtracting the percentage of detractors from the percentage of promoters. Detractors are customers who score 0 to 6 out of 10 when asked about their satisfaction with the product or service. Promoters are customers who score a 9 or 10.
The final NPS score can range from -100 to +100, with a score closer to +100 indicating a higher level of customer satisfaction and loyalty.
Customer Satisfaction (CSAT) Score
CSAT measures how satisfied customers are with your business’s products or experience. You’ll need to conduct a customer feedback survey to calculate your CSAT score. From this survey, take the total number of respondents who answered “satisfied” or “very satisfied” to a particular question and divide it by the total number of respondents who answered that question.
Multiply that number by 100 to get the CSAT score. For example, if a survey question had 100 respondents, and 75 of them answered “satisfied” or “very satisfied,” the CSAT score would be 75%.
Cost of Goods Sold (COGS)
Cost of Goods Sold (COGS) includes the cost of the materials used to make the product, the labor costs associated with producing the product, and other related costs. To calculate COGS, add the cost of the materials used to make the product, the labor costs associated with producing the product, and other related costs. Then subtract this total from the total revenue earned from selling the product to arrive at the COGS.
Churn rate
Churn rate measures the percentage of customers leaving your business or canceling/failing to renew a subscription over a given period. Divide the number of customers who have abandoned their accounts or canceled their subscriptions over a certain period by the total number of customers at the start to calculate your churn rate.
Then, multiply that number by 100 to get the churn rate as a percentage. For instance, if you had 100 customers at the start of the month and 10 of them canceled their accounts or subscriptions by the end of the month, your churn rate would be 10%.
Customer Retention Rate
Customer Retention Rate is a metric that measures the percentage of customers that remain with your business over a period of time. It's calculated by taking the number of customers at the start of a period and dividing it by the number of customers at the end of the period and then multiplying by 100. For example, if a business had 100 customers at the start of a year and 90 customers at the end of the year, its customer retention rate would be 90%.
Repeat Purchase Rate (RPR)
RPR measures the percentage of customers who make more than one purchase from your business. It's calculated by dividing the number of customers who have made multiple purchases by the total number of customers over the same period. For example, if a business had 100 customers and 50 made more than one purchase, the Repeat Purchase Rate would be 50%.
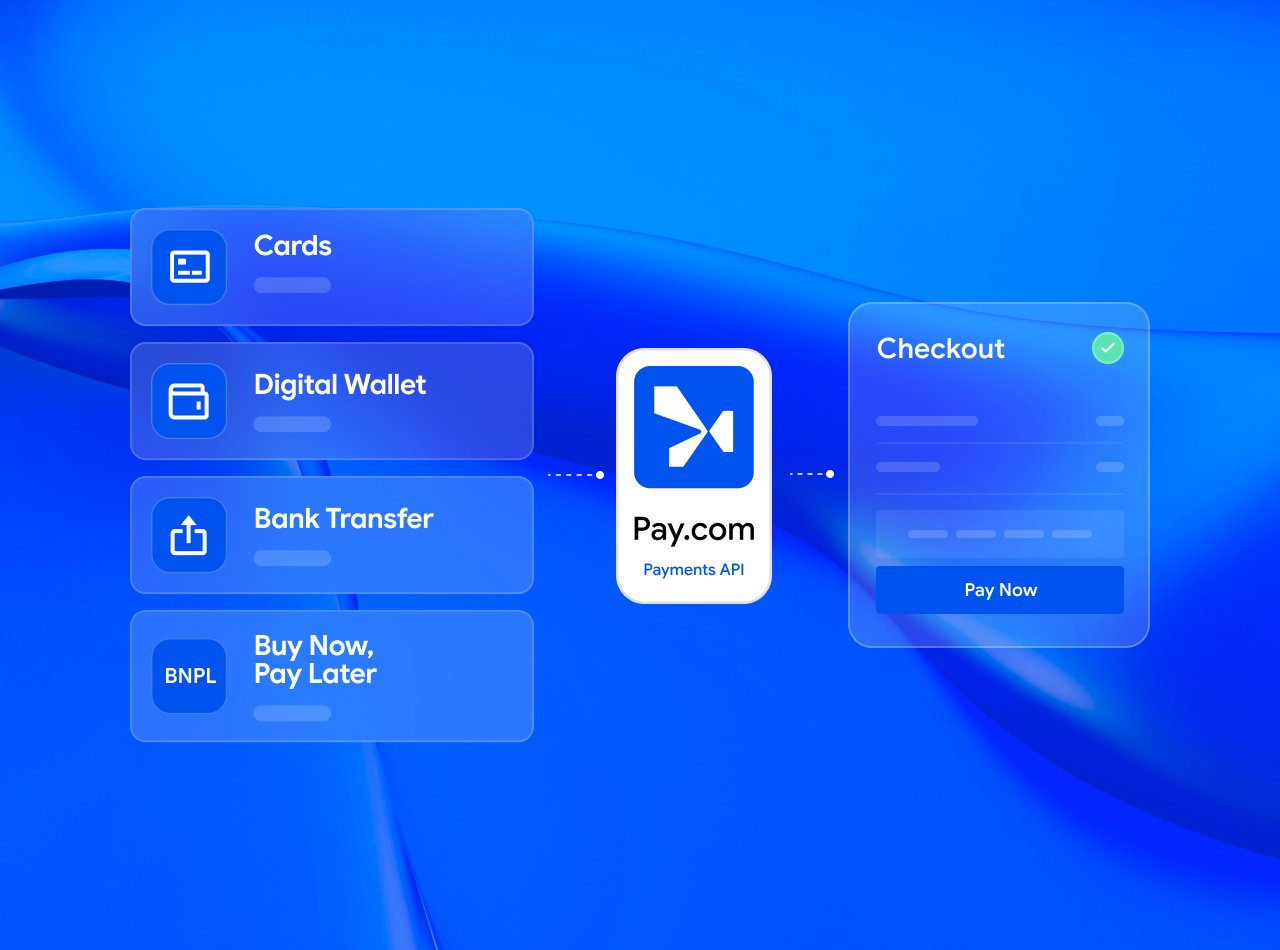
The Benefits of Working with Pay.com as Your Payment Service Provider
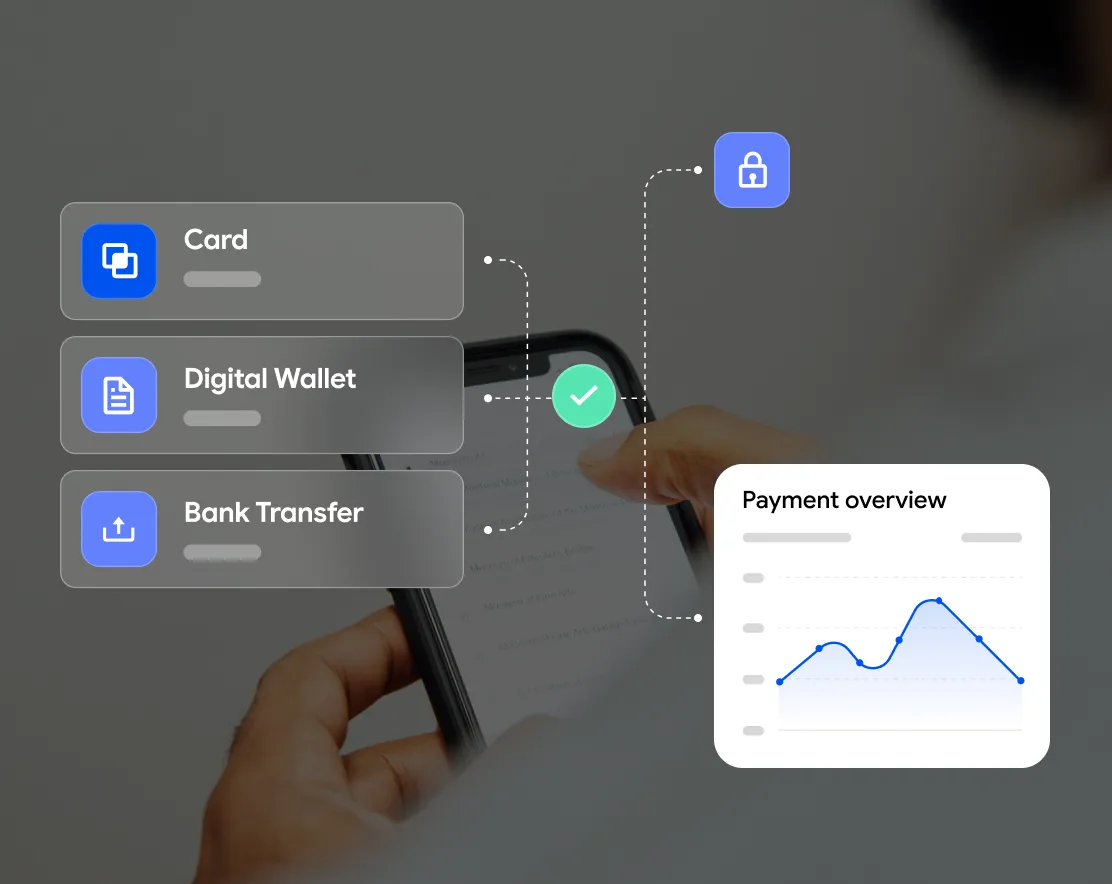
Pay.com offers a secure, compliant, and reliable way to accept payments from customers worldwide. You can offer a wide variety of payment methods and easily add new ones.
The Pay Dashboard simplifies payment management, enabling you to manage everything to do with payments in one place. This includes tracking the status of all your payments, updating customer information, issuing full or partial refunds, and viewing in-depth insights and analytics that drive business results.
Pay.com also offers significant benefits when it comes to compliance and security. Pay.com is level 1 PCI DSS certified (the highest level), meaning you don't have to take on the burden of compliance alone.
With Pay.com, all customers' credit card details are tokenized in transit and the numbers are never stored on our servers. We also support 3D Secure 2.0 for an extra layer of authentication to protect your business from fraud.
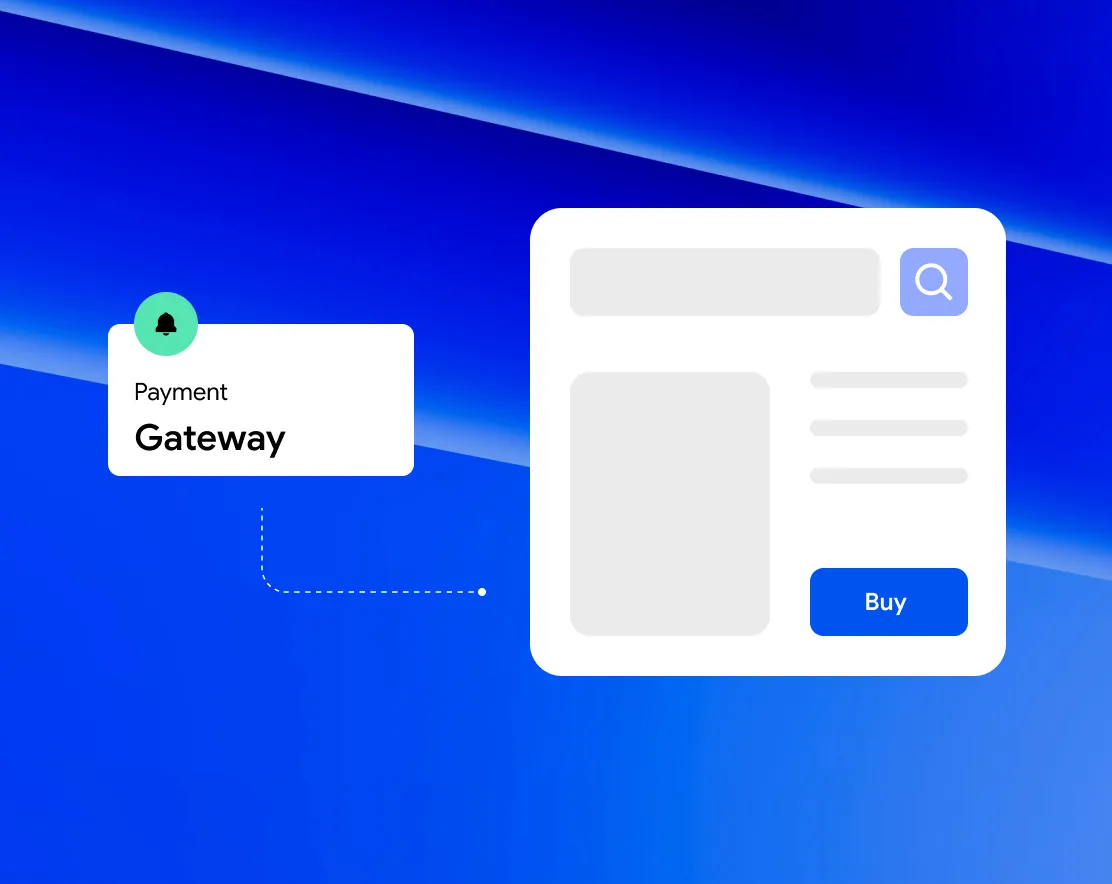
Pay.com is simple to set up. Your developers can seamlessly and securely integrate with our API or SDK so you can get up and running quickly and without hassle.
Click here to get started with Pay.com now!
The Bottom Line
No ecommerce business can grow and operate efficiently without monitoring its performance regularly. By tracking the KPIs listed in this post, you can gauge your performance across business functions and make necessary adjustments to optimize operations, improve financial outcomes and identify strengths and opportunities for growth.
With Pay.com, you can provide a frictionless checkout experience that features multiple payment methods to boost conversions and sales. You can also manage and optimize everything to do with payments in one place. This includes viewing in-depth insights and analytics to better understand your customers’ preferences and needs.
Pay.com makes it simple to provide your customers with a convenient and frictionless checkout experience that converts. Seamlessly integrate with our APIs to enjoy the smoothest and fastest way to accept payments!


Read next
Get payments insights in your inbox


