How to Do a Churn Analysis: 3 Quick & Easy Steps 2026 Update
13 min read
•
15 Feb 2026


As much as companies prefer to focus on how many customers they have, it’s equally important to pay attention to how many customers you are losing, otherwise known as customer churn. By conducting a churn analysis, you can identify which customers are leaving and why. You can even begin to predict which existing customers are looking likely to churn, and then you can take action to prevent and reduce churn.
Instead of getting frustrated when you lose customers, think of it as a learning experience. You can use churn analysis to find new ways to improve your customer retention and make your business stronger than ever. At first glance, a churn analysis will give you statistics and will identify the percentage of your customers who don’t come back for more as compared to the percentage of repeat customers. When you dig deeper into the results of a churn analysis, you will see trends that will help you address challenges head on and improve your bottom line.
Read on to learn more about churn analysis, including when and how to conduct it.
When do you need to do a Churn Analysis?
It’s important to always have a sense of the churn situation in your business. That being said, it’s not necessary - and in fact would be overkill - to conduct a full customer churn analysis every day. Rather, it’s something that should be done on a recurring basis based on your business needs. Many businesses find it most useful to update churn numbers either monthly or quarterly.
However, because churn can be extremely expensive for a company and it can compound and grow quickly, if you start to see any red flags, that is a sign that it’s time to do a churn analysis. For example, if you notice that your churn rate has jumped drastically in one month or you’ve seen a slow increase over a number of months, you should conduct a thorough churn analysis to figure out what is going on and what you can do to improve the situation.
It’s not always a “bad” event that should trigger a churn analysis. This type of analysis can also be very useful to measure the effect of a new onboarding process or the launch of a new product, for example. You may want to conduct a churn analysis after such an event in order to see what the impact - positive or negative - has been on customer retention.
Bottom line, have a set time when you plan to do a periodic churn analysis, but also keep in mind that there are certain triggers that will prompt the need for churn analysis outside of those scheduled times as well.
How can your Business Benefit from Churn Analysis?
There are many benefits to your business when you conduct a customer churn analysis, including:
- Discover product weaknesses and strengths - by analyzing churn, you will uncover patterns and trends that will reveal what causes customers to abandon ship, including price sensitivity. You’ll also start to understand customer behavior during the different stages of the product lifecycle, and you can use that information to improve in areas where customers are less happy and maximize where they are already satisfied.
- Improve communication - gaining a clearer understanding of what your customers’ expectations are at every step in the customer journey will make it easier for you to personalize communication and reach the customers where they are.
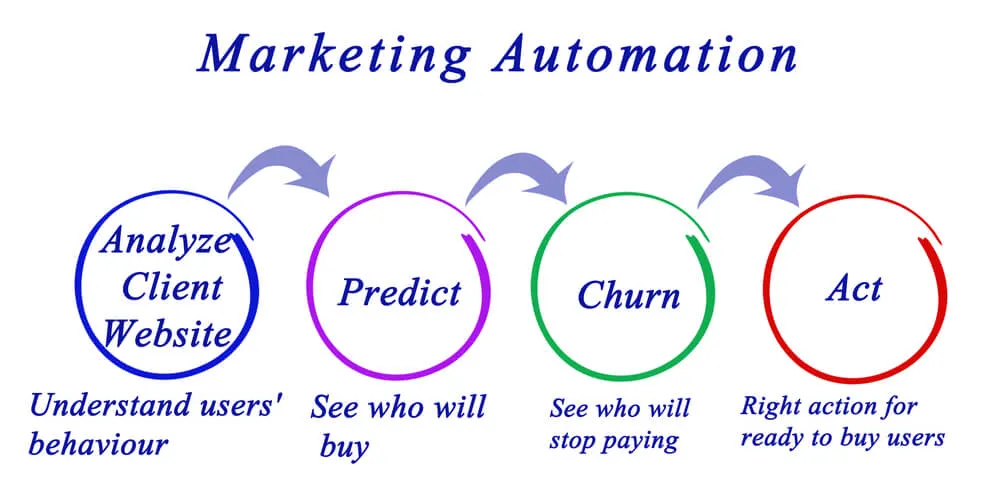
- Predict future churn - looking at the past can help predict the future. Churn analysis can help identify which customers are behaving the same way past-churners did. Then, you can take proactive action to retain those customers and prevent them from churning.
- Increase profits - losing customers means losing money. Churn analysis can help you keep more customers, increasing revenues and profits.
Remember, it costs up to 5 times as much to acquire new customers as it does to keep the ones you already have - so it’s worth the effort to conduct a churn analysis and work to prevent existing customers from leaving.
Main Metrics to Calculate and Use for Analysis
In order to make sure that your churn analysis is accurate and gives you truly actionable insights, you need to choose the right KPIs to measure. The following KPIs are useful when it comes to conducting a strong customer churn analysis:
- Engagement and usage - this is the most important metric to track, as once you see engagement and usage decreasing, customer churn is likely to follow. Understanding how long the customer has been around before usage began to slip is also important to analyze and learn the underlying reasons behind churn.
- Support tickets - tracking the number of customer support requests is insightful - fewer tickets could be a sign that all is running smoothly and all customers are satisfied, but it also could mean that customer engagement is so low that they are no longer even interested in seeking fixes to problems they are having with your product or service.
- Competitor prices - you need to stay competitive with your prices or your churn rates will surely increase. That’s why it’s important to monitor any price changes or special deals that your top competitors are offering so that you can beat or match what they are doing.
- Upgrades and upsells - keep your finger on the pulse of which customers are the most loyal and make sure you nurture those relationships. These are the customers who will be easiest to retain and can help balance out any negative effect caused by those who do churn.
Types of Churn & Why They Happen
When conducting a churn analysis, it’s important to also consider the different types of churn and the reasons behind why customers leave. Armed with this information, you can target your response and make sure you address the specific reasons why customers are choosing to leave.
The most common types of churn are:
- Active churn - customers who actively cancel their purchase or end a subscription fall into this category. They may do this for any number of reasons including bad customer experience, price sensitivities, switching to a competitor or more. This is usually the leading type of churn and most efforts should be focused on addressing and preventing it.
- Passive churn - this type of churn happens when a customer doesn’t complete payment because their card has expired or has reached its limit, for example. This type of churn can be easy to address, especially if your payment infrastructure has safeguards in place to help prevent payments from being denied.
- Good churn - it may sound counterintuitive, but not all churn is bad. Good churn includes the kind that sees non-ideal customers leaving, such as those who were simply a bad fit for your product or service. Good churn also refers to customers who had a short-term need that your business fulfilled. Because of their good experience, they are likely to return when the need arises again.
- Downgrade churn - not all customers disappear completely, but some may downgrade to a cheaper subscription model, for example. This is still considered churn because it will have a negative impact on your profits.
When churn happens, there are different reasons that might lead a customer down that route. Let’s take a look at some of the motivators behind several common types of churn:
Active Churn - Cancel Subscriptions
When a customer actively cancels their use of your product or service, it could be for any number of reasons, including:
- Poor fit - if the product or service was never exactly what the customer was looking for in the first place, they are unlikely to stick around for the long term.
- Functionality - perhaps the product is missing a certain feature or functionality that the customer was expecting or needs. If it’s not available, the customer will look elsewhere.
- Failure - if the customer was expecting to get a certain outcome from the product or service, but failed to do so (whether it’s the company’s fault or not!), they are likely to churn.
Active Churn - Switch to Competitor
If a competitor is offering a better deal or can otherwise convince your customers that they are the optimal solution, you will see a steady stream of customers filing out of your (virtual) door. Always keeping an eye on what your competitors are up to can be the difference between retaining customers and watching them go.
Passive Churn - Not Renewing Subscription
You may see customer churn simply due to the fact that some people won’t realize that they had to actively renew a subscription so they just let it lapse. These are difficult customers to get back, so it’s worth developing relationships and making sure you remind the customers you want to keep that they must renew subscriptions. Make it worthwhile for them so that they know that you care about them and want to keep their business.
How to Perform Customer Churn Analysis
Now that you know what churn analysis is and what the benefits are, you may be wondering how to actually perform a customer churn analysis. Luckily, there are plenty of tools out there that can help you, and conducting a churn analysis is not as difficult as it may sound. There are lots of different models and ways that you can go about it, but here’s one way that we suggest:
Step One: Subscription Analytics
Get yourself a tool that lets you gather and then see all of the metrics of your choice in one place. This is where you will collect the data about your customers’ behavior and will be able to drill down and see exactly what is going on at any given time. A good system will let you choose which metrics you want to see on your dashboard - such as cancelled subscriptions - and will also include automated alerts so that you’ll know when any red flags arise that require investigation.
Step Two: Analyze Customers in Segments
Trying to look at each customer individually is time consuming and won’t necessarily give you any added-value over analyzing groups - or segments - of customers who behave in similar ways or share common traits. Most analysis tools will allow you to segment your users or customers based on income, industry or other specific demographics such as geographic location.
- Churn analysis by income - if you are able to see the income level of a group of customers, you may reveal that there’s a certain price point at which people simply cannot afford your product. This can help you adjust your pricing accordingly or offer special deals at certain times of the year to help prevent churn.
- Churn analysis by industry - you can look at churn rates across your specific industry in order to see how your specific business is stacking up. Ahead of the game? Good for you - keep up whatever you are doing! Behind the curve? Now’s the time to take action and see what you can do to reduce customer churn.
- Churn analysis by geography - identifying where customers are located can give you important clues into why they may be churning. It could be due to tax regulations or payment processing issues in a specific location or maybe it’s down to cultural differences.
Step Three: Identify When and Why Churn is Happening
Once you’ve gathered the data and analyzed it, you will reveal the answers as to when and why churn is happening in your business. You’ll see the percentages of active vs. passive churn, as well as where in the product lifecyle most of the churn is happening. The end result is the answers to the questions of which customers are churning and why. You can bolster the results you get from your analytics tool by sending out surveys and simply asking customers what made them leave.
You can play around with the data you’ve collected in many different ways in order to find the answers to all of your burning questions about when and why churn is happening. You can drill down to get as much detail as possible and really understand the reasons behind customer behavior. You can then use this information to create a plan to encourage your best customers to stay.
Using Software to Calculate Churn Analysis
While there are many tools that can automatically calculate churn for you, some people may prefer to do it manually. It is possible - and easy for those who are comfortable with software tools - to use programming tools like Python and R to conduct a thorough churn analysis. A more simple analysis can even be done using Excel.
Churn Analysis with Python
Python is a programming tool that uses data science and machine learning to help make predictions. It’s possible to use a data set to analyze customer behavior and attributes and predict the likelihood of churn. In Python, you can choose the features within the data set that are relevant to whether or not a customer will churn. For example, if a bank is analyzing which customers may churn, they may look at things like credit score, location, bank balance, age, and length of time the customer has been with the bank. An algorithm is applied to the data and then predicts, based on the chosen features, which customers are most likely to churn.
This analysis can then be used to take preventative measures and prevent the churn from happening.
Churn Analysis with R
Similar to Python, R is also a programming language - it is designed for computing statistics and can be a powerful tool for churn analysis. It operates in a very similar way to Python in terms of choosing a data set and then applying a statistical model to it in order to predict which customers are most likely to churn.
Churn Analysis with Excel
Excel is a simple yet powerful tool that can also be used to conduct a churn analysis. For those who don’t know how or don’t want to use a more complex tool like Python or R, Excel is a good option. All of the relevant data should be added to an Excel spreadsheet and then you can insert a pivot table and use the “churn rate calculation” in order to identify variables that correlate with churn. Variables with a high correlation indicate the types of customers who are likely to churn.
Churn Analysis Example
Whatever software or program you use to conduct your churn analysis, it’s ultimately based on the churn rate formula, which is as follows:
Churn rate = number of lost customers/ending total of customers
The best way to understand this is via an example:
Company X is a subscription business that began the year with 100,000 customers and ended the year with 120,000 customers. On the surface, that shows a 20% growth rate which is a good thing.
But, if you dig below the surface you will learn that the company lost 40,000 existing customers during that period and the growth was due to increased spending on acquiring new customers. In this example, churn would be calculated as follows:
40,000 lost customers/120,000 ending total of customers = 33% churn rate
That’s a high churn rate - working on lowering that will result in even better growth for the company.
Emily is a content writer with a special interest in fintech and business. She loves sharing her knowledge to help small businesses take their first steps towards success.
Read next
Get payments insights in your inbox


